Horizontally aligned ggplots
library(ggplot2)
library(magrittr)
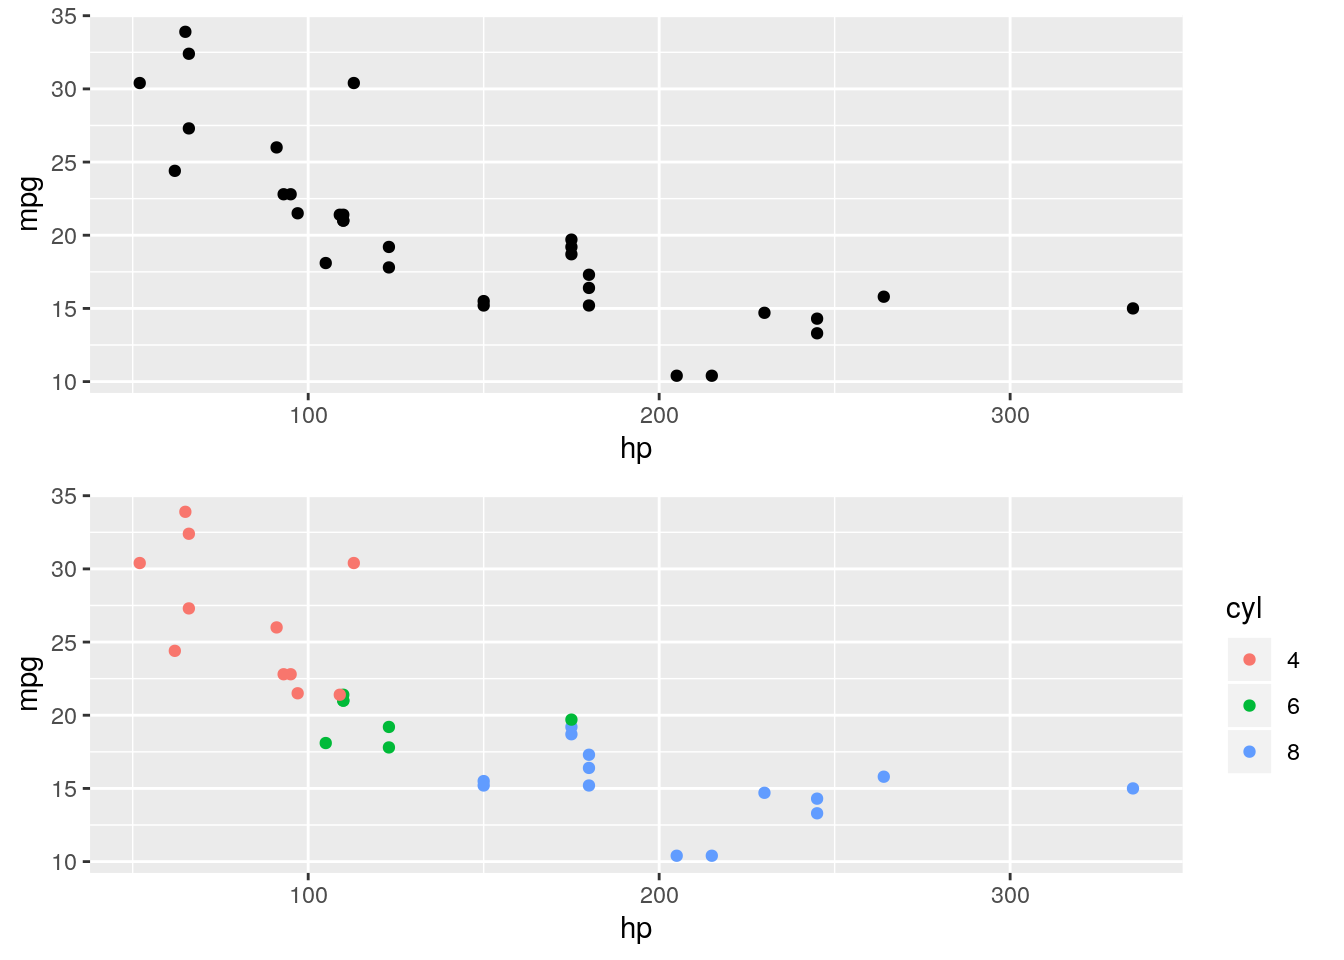
Consider two plots sharing the same x axis, but having different widths.
p1 <- ggplot(mtcars, aes(hp, mpg)) + geom_point()
p1
p2 <- mtcars %>%
    dplyr::mutate(cyl = as.factor(cyl)) %>%
    ggplot(aes(hp, mpg, color = cyl)) + geom_point()
p2
I would like to combine these two plots such that the x axes are of equal size instead of the total width being equal.
That is, without the cyl label interferring.
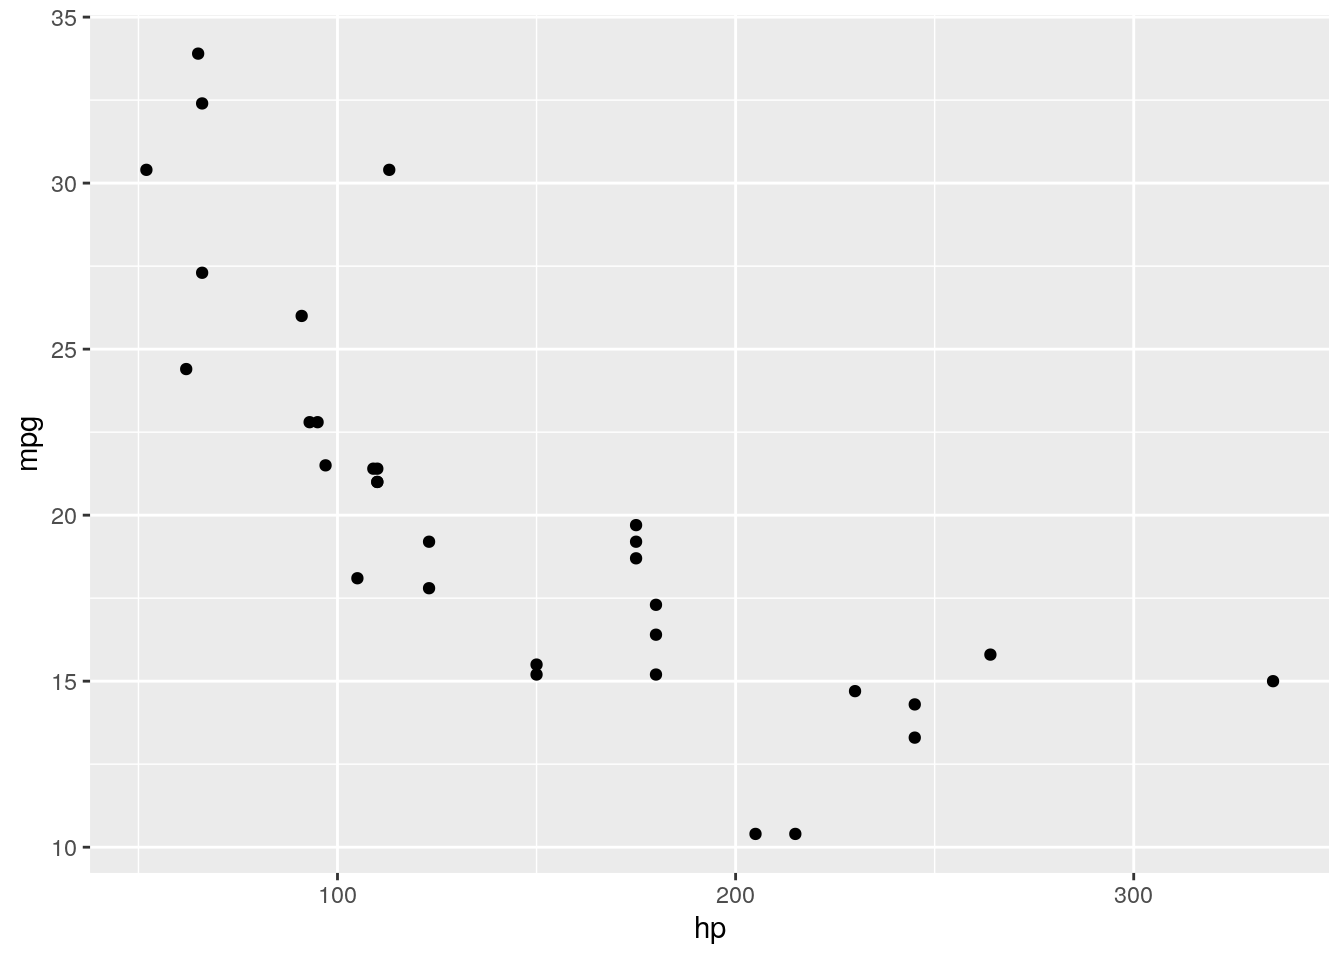
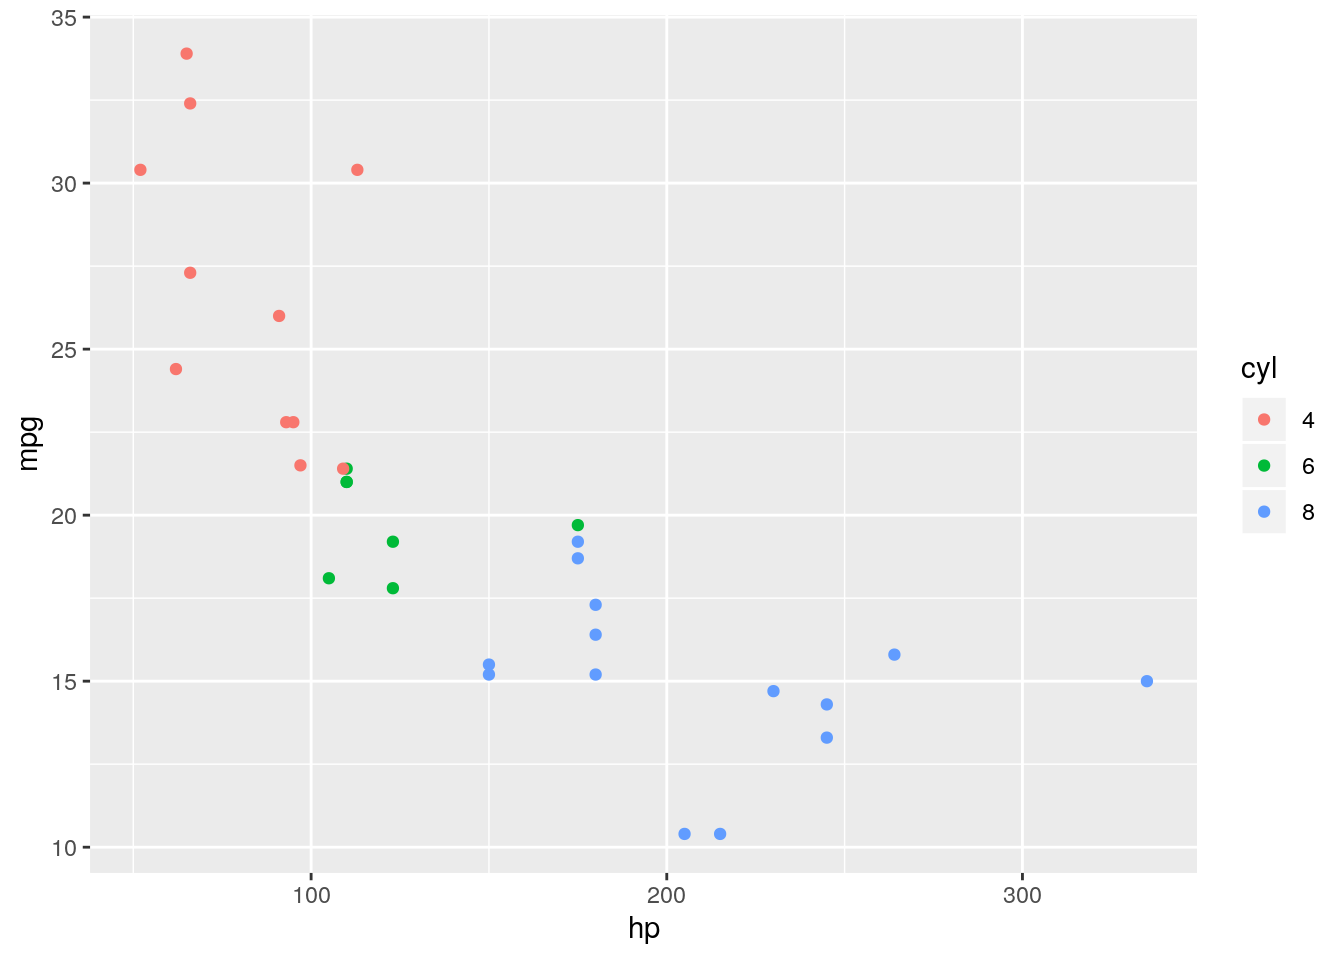
Here is a solution using the gtable package:
g1 <- ggplot2::ggplotGrob(p1)
g2 <- ggplot2::ggplotGrob(p2)

max_plot_width <- grid::unit.pmax(g1$widths, g2$widths)
g1$widths <- max_plot_width
g2$widths <- max_plot_width

plot_matrix <- matrix(list(g1, g2), nrow = 2)

g <- gtable::gtable_matrix(
    name = "HP vs MPG", grobs = plot_matrix,
    widths = grid::unit(x = c(4), units = c("null")),
    heights = grid::unit(x = c(4, 4), units = c("null"))
)

grid::grid.newpage()
grid::grid.draw(g)