ggplot a time series with multiple groups
library(ggplot2)
library(magrittr)
Consider a simple time series:
tbl <- tibble::tibble(
    Date = seq(from = as.Date("2020-01-01"), to = as.Date("2020-01-31"), by = 1),
    Value = rnorm(31)
)
I want to plot this time series, but with weekdays and weekends having different colors.
First I add a column with the kind of day:
tbl_with_days <- tbl %>%
    dplyr::mutate(
        DayOfWeek = lubridate::wday(Date, week_start = 1),
        DayType = ifelse(DayOfWeek <= 5, "Weekday", "Weekend")
    )
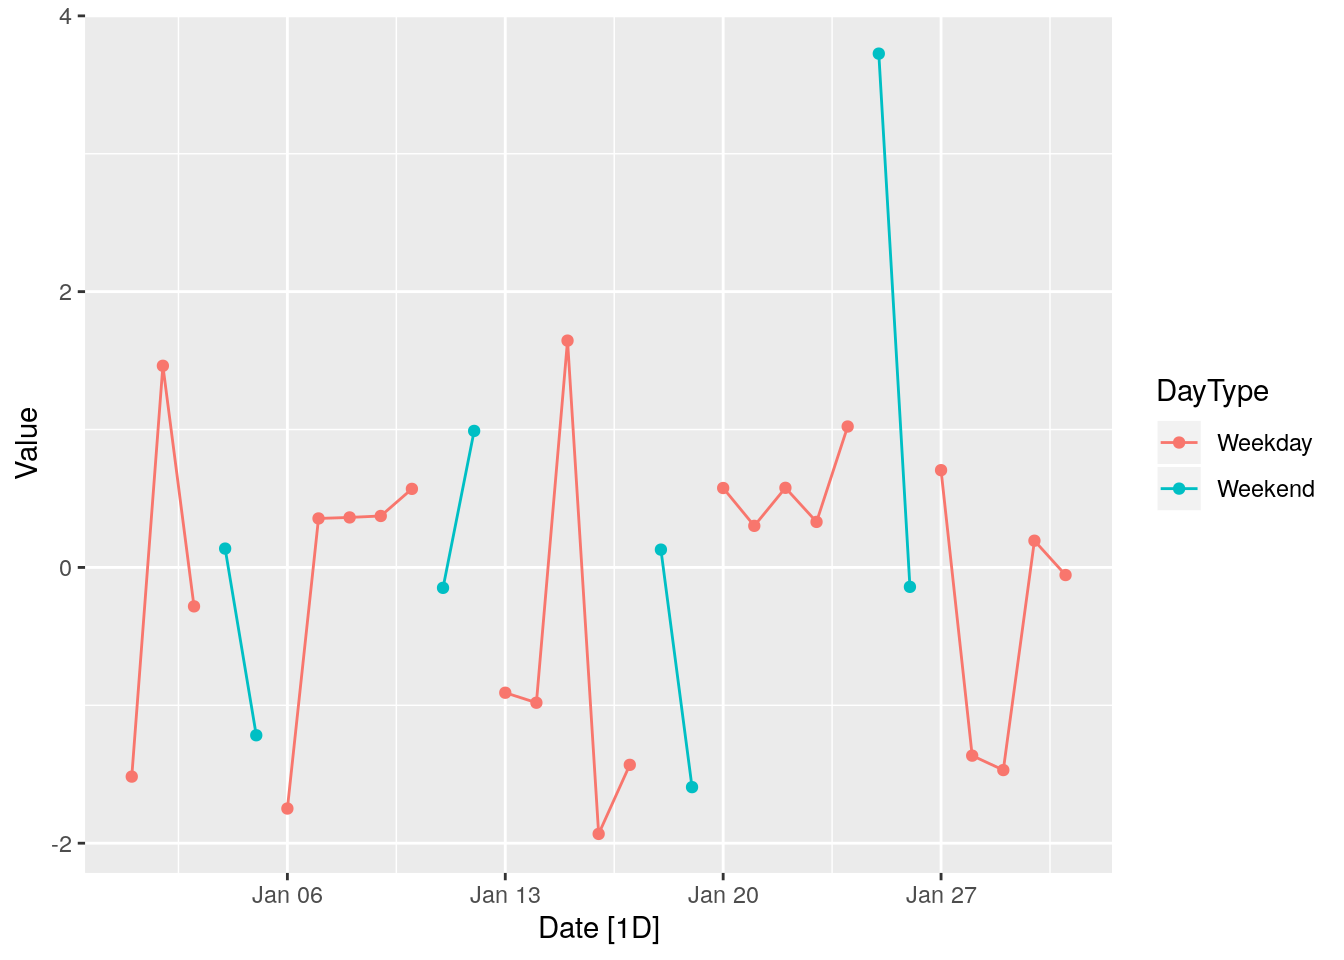
Simply adding colors to a ggplot will not look correct, because ggplot connects points within the same group:
tbl_with_days %>%
    ggplot(aes(Date, Value, color = DayType)) +
    geom_point() +
    geom_line()

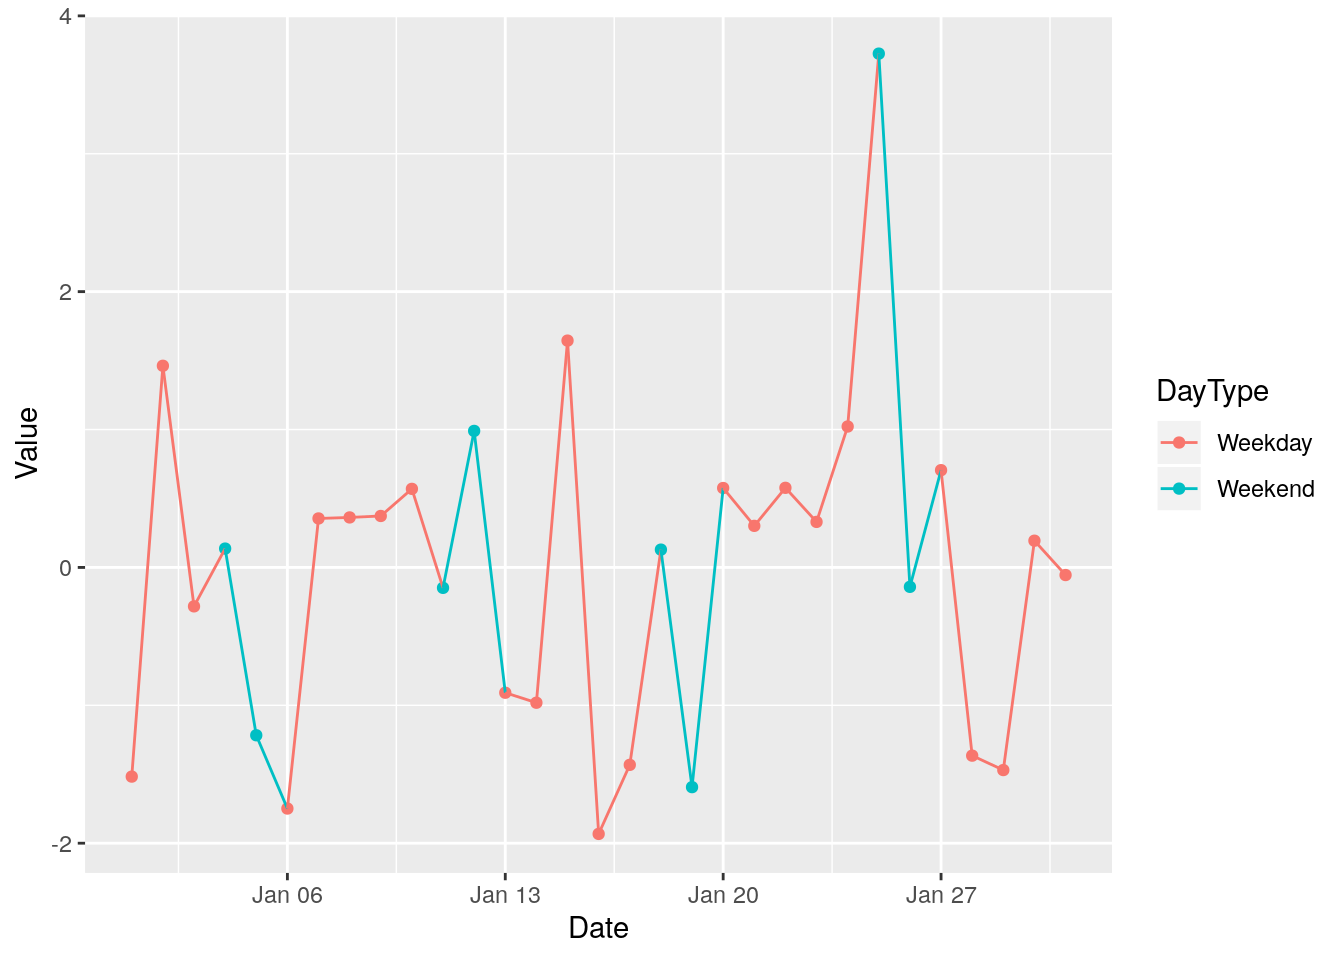
Instead we can use a slightly different aesthetic in the ggplot command:
tbl_with_days %>%
    ggplot(aes(Date, Value, group = 1, color = DayType)) +
    geom_point() +
    geom_line()
Tsibbles
Since we are dealing with time series it is tempting to use the tsibble package.
First the tibble is converted to a tsibble.
tsbl_with_days <- tbl_with_days %>%
    dplyr::select(Date, DayType, Value) %>%
    tsibble::as_tsibble(key = DayType, index = Date)
In tsbl_with_days the key parameter specifies that we have two kinds of time series, namely for the kind of DayType.
Furthermore, for a regularly sampled time series, we can fill in the implicitly missing observations with NA.
Now the autoplot function from ggplot is extended in the accompanying feasts package to work well with tsibbles:
tsibble::fill_gaps(tsbl_with_days) %>%
    feasts::autoplot(Value) + geom_point(na.rm = TRUE)